Analytics Page: Activity Impact by Stage Chart
Last updated: August 6, 2026
Overview
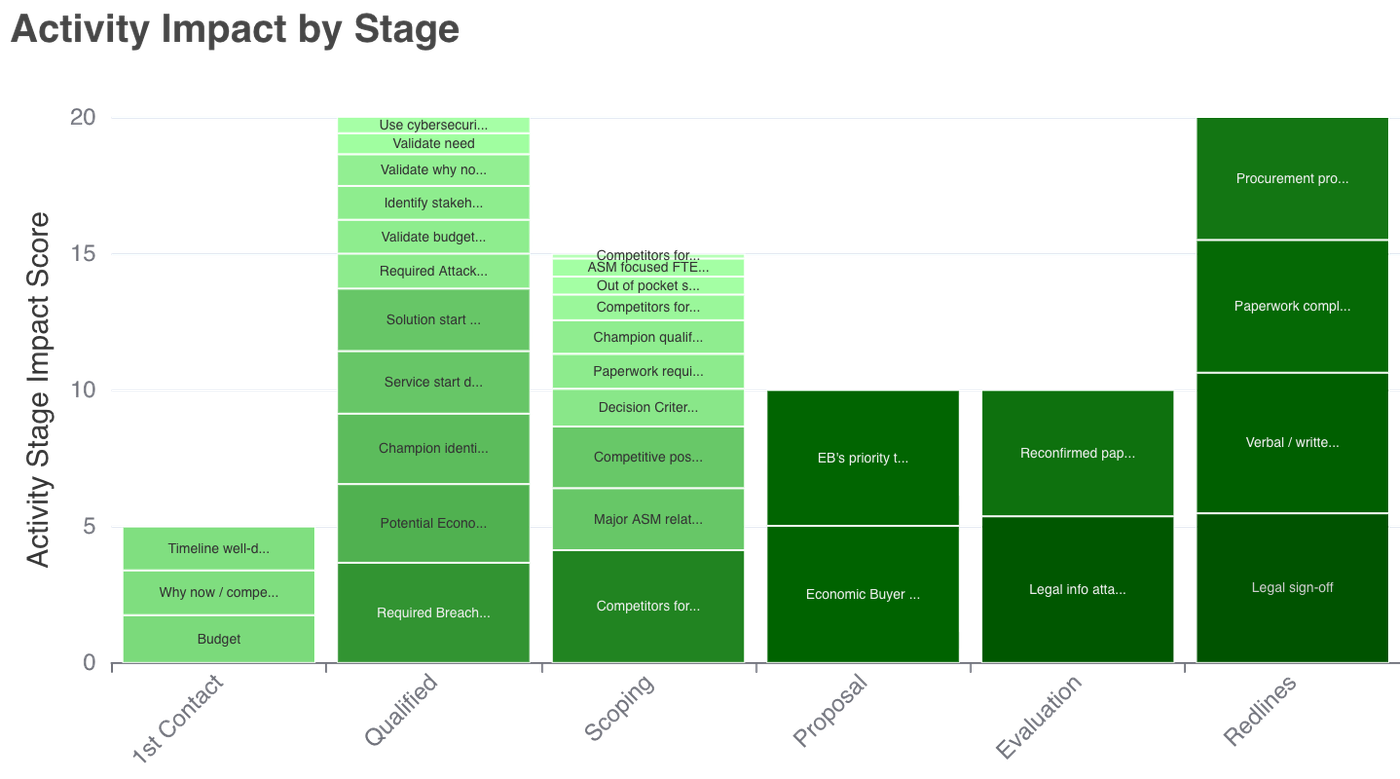
The Activity Impact by Stage chart shows the absolute impact of answers to Spotlight.ai Questions at each sales stage. Unlike the normalized version, this view highlights where impact is concentrated across the funnel, making it easier to see which stages matter most overall.
This chart helps Sales Ops understand where execution has the greatest leverage and where missing signals are most costly.
How to Read the Chart
Each column represents a sales stage.
Each segment represents an answer to a Spotlight.ai Question.
The total height of a column reflects overall impact at that stage.
Larger segments indicate Question answers with stronger association to successful progression.
For example, a taller column suggests that outcomes are more sensitive to execution quality at that stage compared to others.
What This Chart Is (and Isn’t)
This chart is:
A way to see where impact concentrates across the sales funnel
Useful for identifying high-leverage stages
A complement to the normalized stage-impact view
This chart is not:
A comparison of relative importance within a stage
A measure of activity volume or effort
Proof that one activity alone determines success
How Sales Ops Should Use This
Focus on enablement and process rigor on high-impact stages
Identify stages where missing signals disproportionately affect outcomes
Allocate coaching and inspection effort based on impact concentration
Pair this view with normalized impact to understand both “where” and “what” matters
For example, if later stages show much higher total impact, Sales Ops may prioritize stronger governance and validation before deals enter those stages.
Sales Ops – Recommended Actions
Process & Stage Governance
Tighten stage definitions and exit criteria in high-impact stages.
Require stronger signal validation before allowing advancement.
Enablement & Resourcing
Invest in enablement resources where impact is highest.
Ensure reps are equipped to execute the most critical activities at those stages.
Deal Reviews
Spend more review time on deals in high-impact stages.
Challenge progression when key Question answers are missing or weak.
Trend Monitoring
Watch for shifts in which stages carry the most impact.
Treat changes as indicators of evolving buyer behavior or sales motion changes.
Important Interpretation Notes
This chart shows absolute impact, not relative importance within a stage.
Results reflect association, not causation.
Interpret alongside normalized views, deal context, and qualitative insights.