Analytics Page: ICP / Wins Analysis Chart
Last updated: August 6, 2026
Overview
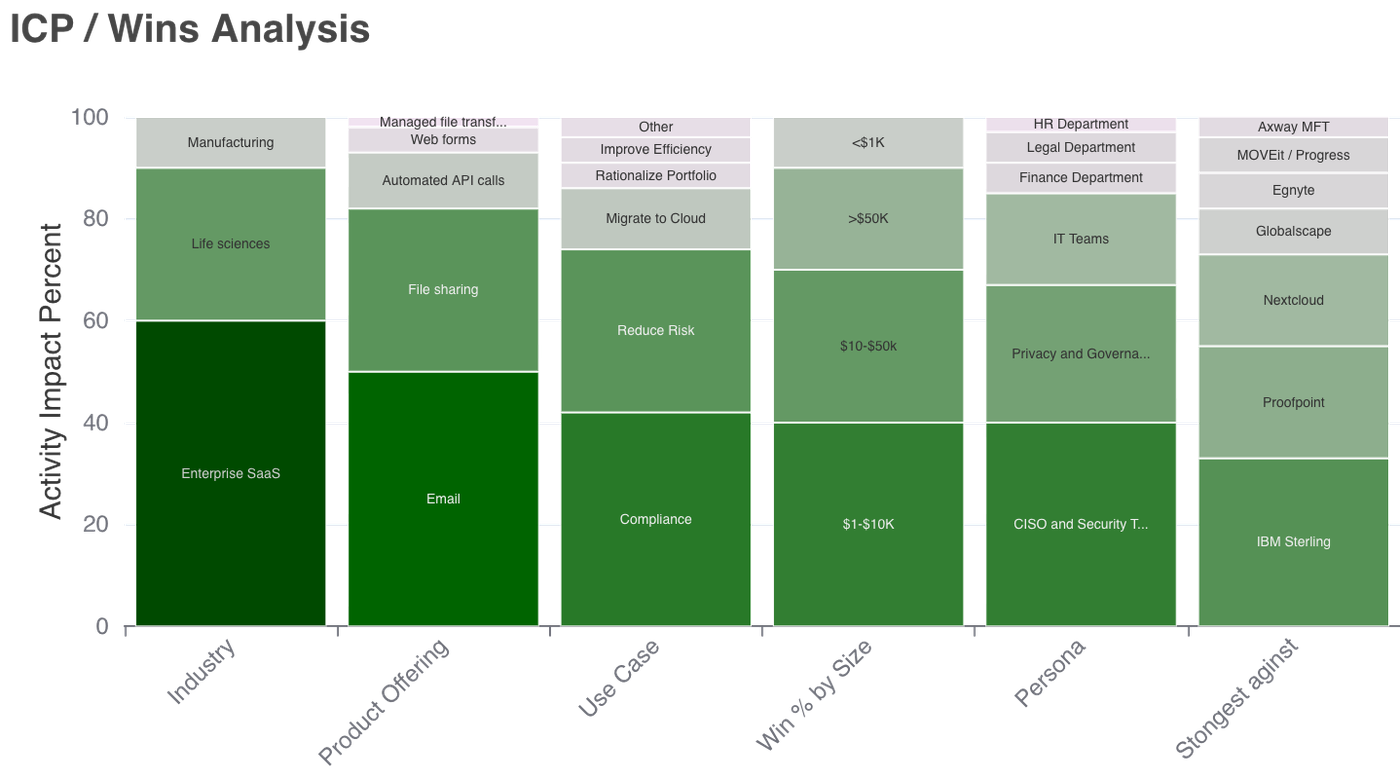
The ICP / Wins Analysis chart shows how answers to Spotlight.ai Questions are associated with successful outcomes. It highlights which Question answers in your data are most strongly associated with closed-won deals.
The specific Questions and answers shown in this chart are customer-specific and depend on how Spotlight.ai is configured in your workspace.
How to Read the Chart
Each column represents a Spotlight.ai Question included in this analysis.
Each segment within a column represents an answer to that Question.
Larger segments indicate a stronger association with wins, based on historical closed-won deals.
The chart is normalized to show relative impact, not raw deal volume.
For example, when one answer occupies a noticeably larger portion of a column, it indicates that this answer appears more frequently in winning deals relative to other answers for the same Question.
What This Chart Is (and Isn’t)
This chart is:
A way to identify which Question answers are most strongly associated with wins
A tool for spotting patterns across winning deals
Useful for comparing relative impact within each Question
This chart is not:
A guarantee of future wins
A statement that certain answers cause deals to close
A comparison across different customers or datasets
How Sales Ops Should Use This
Refine ICP definitions based on the Question answers that show the strongest win association in your data
Inform deal scoring, prioritization, and forecast confidence using high-impact answer combinations
Guide enablement and coaching toward the deal characteristics that consistently appear in wins
Monitor changes in win drivers over time as an indicator of ICP or go-to-market shifts
For example, when new answers begin to show higher impact, this may signal a change in buyer behavior or sales motion effectiveness.
Sales Ops – Recommended Actions
Qualification & ICP Alignment
Ensure high-impact Question answers are reflected in qualification criteria.
Validate that routing, scoring, and targeting logic aligns with what is actually driving wins in your data.
Pipeline Prioritization
Flag deals that match multiple high-impact answers as higher-confidence opportunities.
Use low-impact patterns to challenge assumptions during pipeline and forecast reviews.
Enablement & Coaching
Align playbooks and discovery guidance with the Question answers that most strongly correlate with wins.
Focus enablement where win association is highest.
Forecasting & Planning
Incorporate high-impact answers into forecast confidence models.
Track changes in impact over time to detect early signs of ICP drift or GTM shifts.
Key Reminder
This analysis reflects correlation, not causation. High-impact answers indicate where wins concentrate in your dataset, but they do not guarantee outcomes without strong execution and deal context.