Analytics Page: Win/Loss Probability by Stage
Last updated: August 7, 2026
Overview
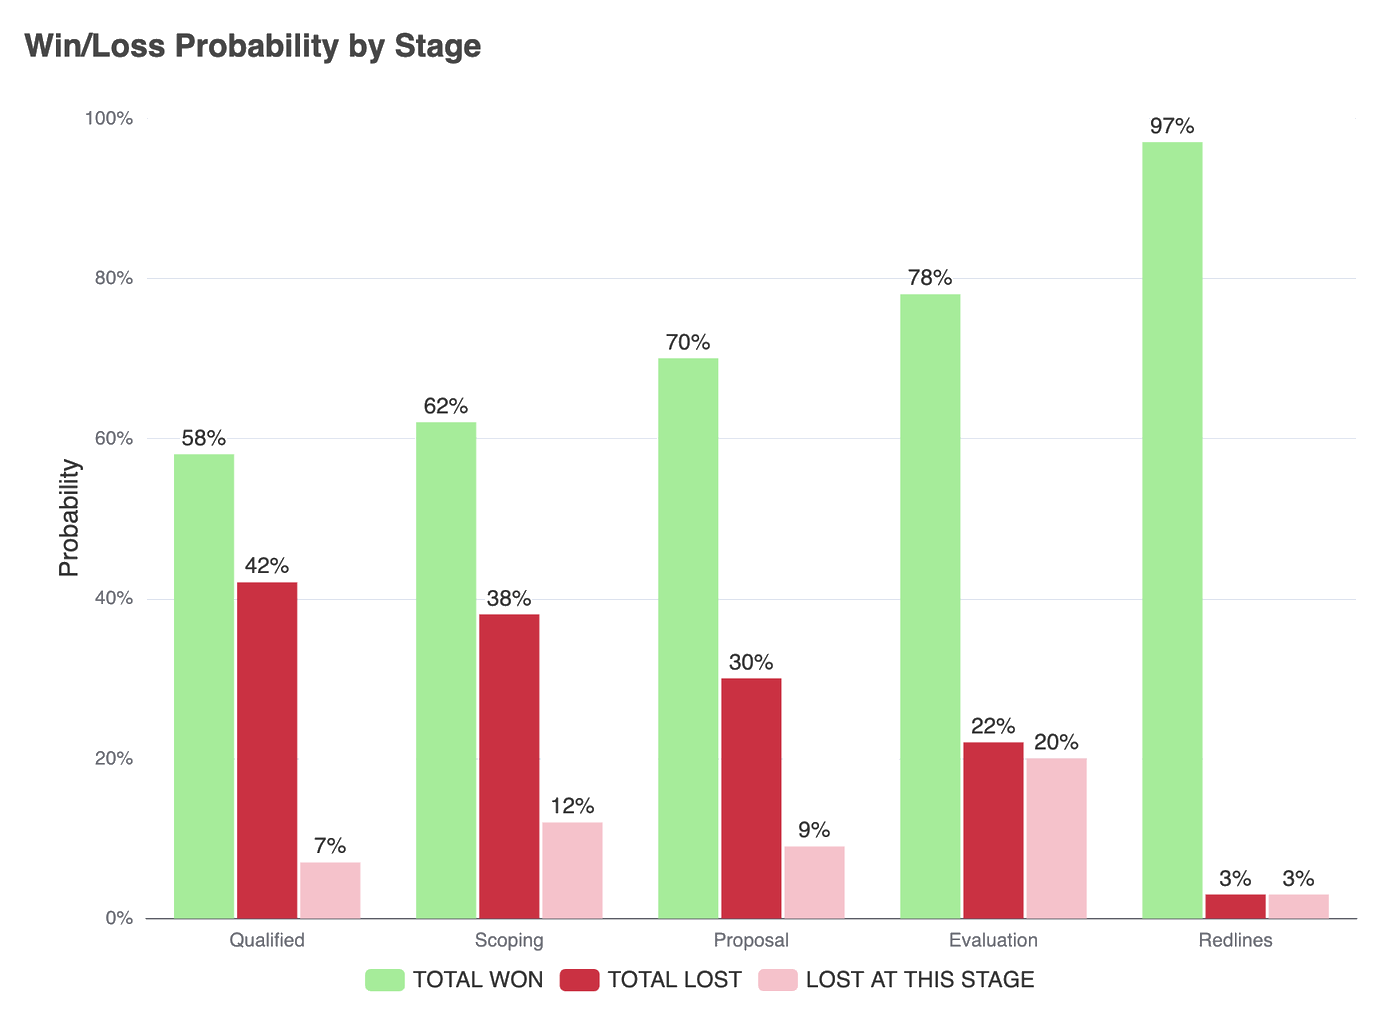
The Win/Loss Probability by Stage chart shows how deal outcomes evolve as opportunities progress through the sales funnel. For each stage, it displays:
The probability that deals ultimately close won
The probability that deals ultimately close lost
The probability that deals are lost specifically at that stage
This view helps Sales Ops understand how confidence changes by stage and where deals are most vulnerable to loss.
How to Read the Chart
Each sales stage is shown along the horizontal axis.
Bars represent outcome probabilities based on historical deal data.
Total Won reflects the share of deals that eventually closed won after reaching that stage.
Total Lost reflects the share of deals that eventually closed lost after reaching that stage.
Lost at This Stage highlights where deals most commonly exit the funnel.
For example, a stage with a high “lost at this stage” probability represents a common drop-off point in the sales process.
What This Chart Is (and Isn’t)
This chart is:
A way to measure deal confidence by stage
A tool for identifying high-risk stages
Useful for understanding where losses tend to occur
This chart is not:
A guarantee that a deal at a given stage will close
A replacement for deal-level risk assessment
A measure of rep performance
How Sales Ops Should Use This
Identify stages where loss risk remains high
Strengthen qualification and validation before deals enter high-risk stages
Adjust forecast confidence based on stage-level probabilities
Focus enablement and inspection on stages with high drop-off
For example, if deals are frequently lost during evaluation, Sales Ops may tighten exit criteria or introduce additional stakeholder validation earlier.
Sales Ops – Recommended Actions
Stage Risk Management
Treat stages with high loss probability as risk checkpoints.
Require stronger validation before advancing deals into later stages.
Forecast Discipline
Align forecast categories and confidence levels with stage-level win probabilities.
Challenge commits in stages where loss probability remains elevated.
Process Improvements
Review stage definitions and required activities where losses concentrate.
Address recurring drop-off points through enablement or process changes.
Trend Monitoring
Track changes in win/loss probability by stage over time.
Use shifts as early signals of funnel health changes.
Important Interpretation Notes
Probabilities are based on historical outcomes, not guarantees.
Deals may progress differently depending on context, deal size, and execution.
Stage definitions and usage affect results.
Always interpret probabilities alongside deal context and qualitative judgment.