Analytics Page: Reps Qualifications Accuracy Chart
Last updated: August 6, 2026
Overview
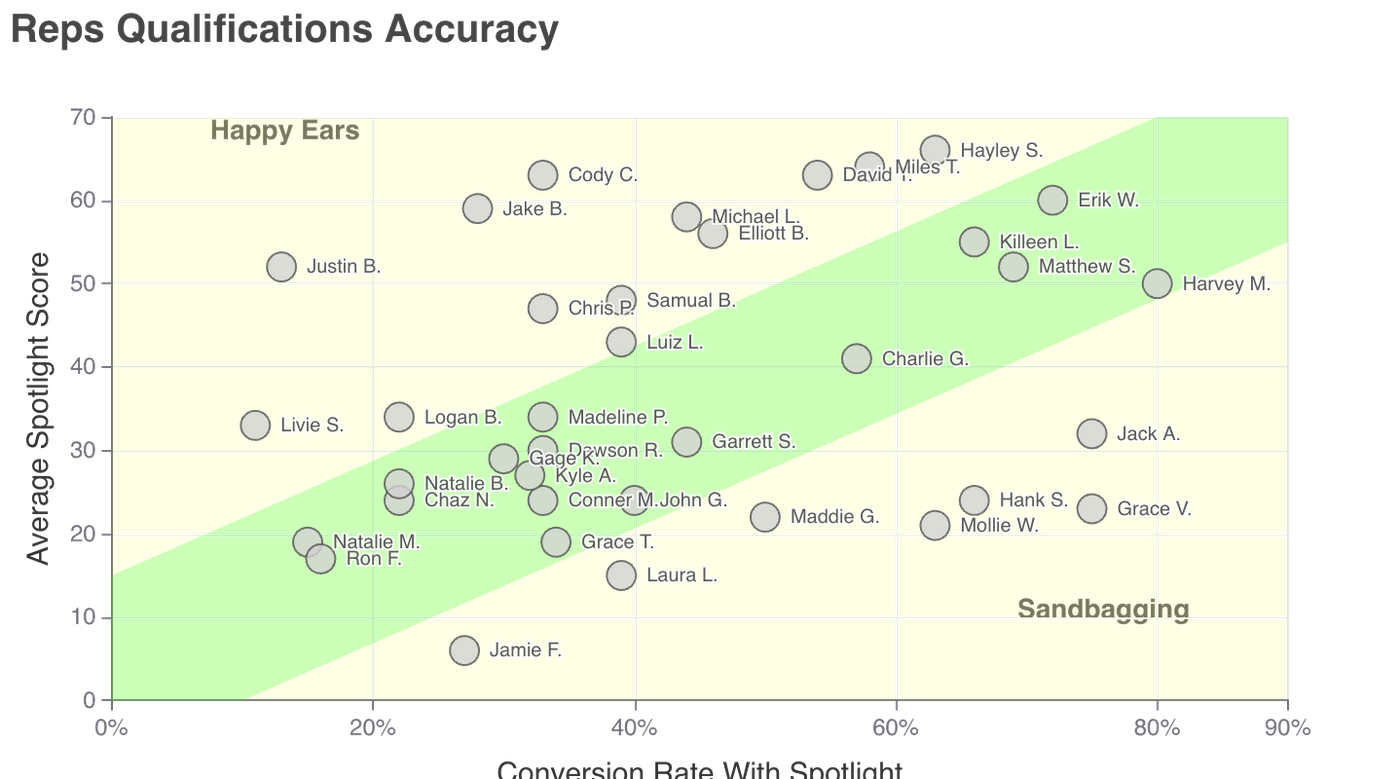
The Reps Qualifications Accuracy chart evaluates how closely a rep’s qualification assessment aligns with actual deal outcomes. It plots:
Conversion rate on the x-axis
Average Spotlight.ai score on the y-axis
Each dot represents a rep. The diagonal alignment band highlights where qualification rigor and outcomes are well matched.
This view helps Sales Ops identify Happy Ears, Sandbagging, and well-calibrated qualification behavior across the team.
How to Read the Chart
Each dot represents a single sales rep.
The x-axis shows the rep’s conversion rate.
The y-axis shows the rep’s average Spotlight.ai score, reflecting perceived deal health.
Reps close to the diagonal band show strong alignment between qualification and outcomes.
Distance from the band indicates systematic qualification bias.
Qualification Patterns Explained
Happy Ears
High Spotlight.ai scores with lower conversion rates
Indicates deals are being qualified more optimistically than outcomes support
Often inflates pipeline confidence and forecast risk
Sandbagging
Lower Spotlight.ai scores with higher conversion rates
Indicates conservative qualification and understated deal strength
Can hide real upside and slow pipeline momentum
Well-Calibrated
Spotlight.ai scores closely track conversion rates
Indicates accurate qualification and reliable pipeline signals
How Sales Ops Should Use This
Identify reps whose qualification approach introduces forecast risk
Focus coaching on calibration, not just activity or volume
Improve predictability by aligning qualification signals with outcomes
Balance optimism and conservatism across the team
For example, correcting Happy Ears improves forecast reliability, while correcting Sandbagging surfaces hidden capacity and upside.
Sales Ops – Recommended Actions
Calibration Coaching
Coach reps showing Happy Ears to tighten validation and evidence standards.
Coach Sandbaggers to trust qualification signals and advance deals appropriately.
Forecast Discipline
Adjust forecast confidence based on demonstrated qualification accuracy.
Use this chart during forecast reviews to challenge assumptions.
Enablement & Standards
Reinforce consistent interpretation of Spotlight.ai signals.
Use well-calibrated reps as benchmarks in training.
Performance Monitoring
Track rep movement toward the alignment band over time.
Treat persistent misalignment as a priority coaching signal.
Important Interpretation Notes
This chart measures qualification accuracy, not effort or intent.
Conversion rate reflects outcomes over time and may lag recent behavior changes.
Spotlight.ai scores reflect deal signals, not deal size or quota impact.
Always interpret results alongside tenure, territory, and deal mix.