
Analytics Page: Reps Ramp Up and Pipeline Strength
Overview
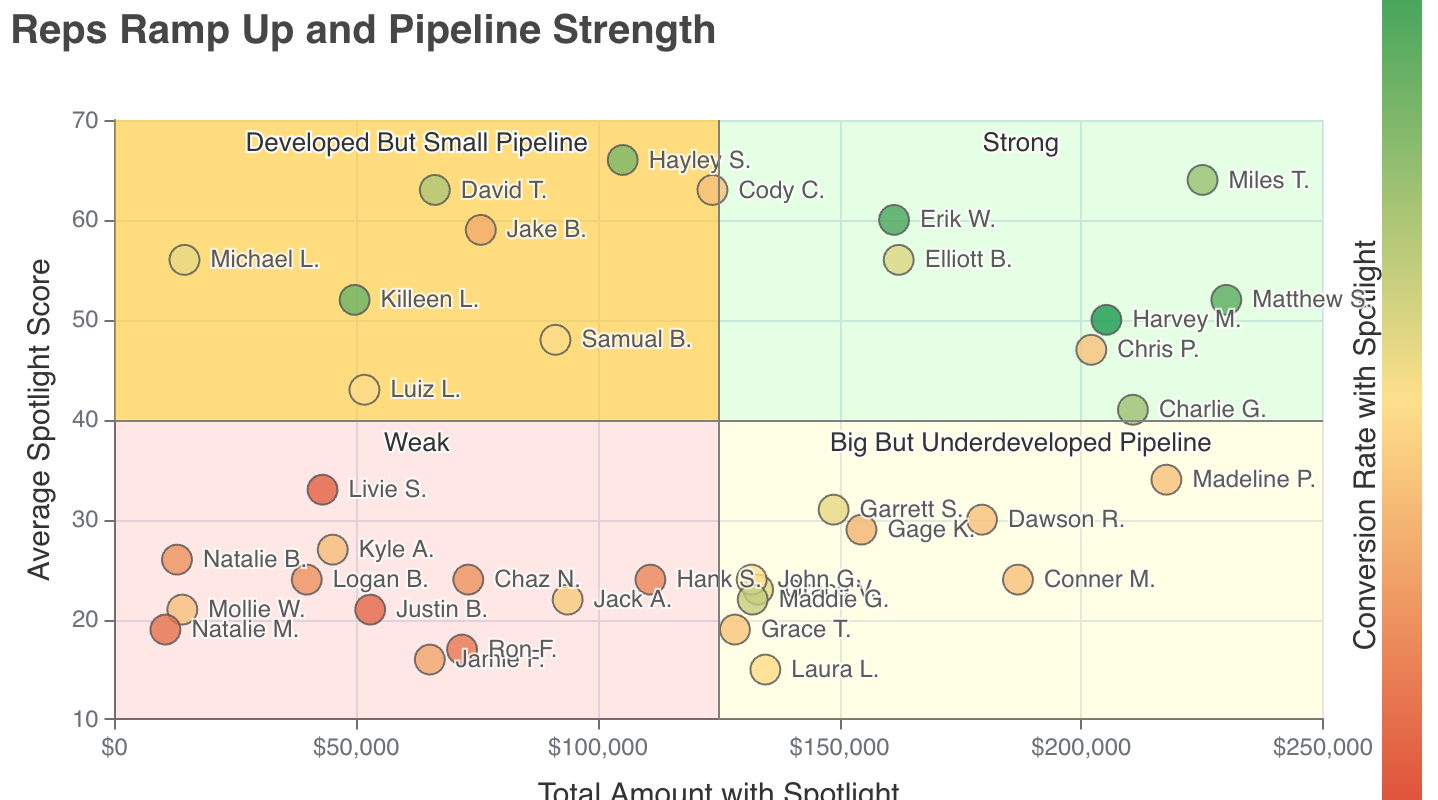
The Reps Ramp Up and Pipeline Strength chart visualizes individual sales reps across three dimensions:
Total pipeline amount (horizontal axis)
Average Spotlight.ai score across their deals (vertical axis)
Conversion rate (dot color)
Each dot represents a rep and helps Sales Ops evaluate pipeline volume, deal quality, and conversion effectiveness in a single view.
The Spotlight.ai score is a measure of a deal's health and execution quality, based on signals like engagement, qualification, and validation. A rep's average score reflects the overall quality of the deals in their pipeline.
How to Read the Chart
Each dot represents a single sales rep.
The x-axis shows the rep's total pipeline amount.
The y-axis shows the rep's average Spotlight.ai score, reflecting overall deal health and execution quality.
Dot color represents conversion rate, with color intensity indicating how effectively pipeline converts into wins.
Quadrants group reps into common performance profiles.
How to Interpret Rep Profiles
Reps with high pipeline but lower Spotlight.ai scores may be carrying a larger volume of lower-quality or less-validated deals, which can inflate apparent pipeline strength without translating into wins.
Reps with lower pipeline but higher Spotlight.ai scores often maintain tighter qualification standards and stronger deal validation, resulting in higher-quality but more conservative pipeline coverage.
Reps with high Spotlight.ai scores and strong conversion rates tend to be fully ramped with a healthy, executable pipeline.
Reps with low Spotlight.ai scores and low conversion rates may still be ramping or may need focused coaching and support.
How Sales Ops Should Use This
Balance expectations between pipeline volume and deal quality
Identify whether performance gaps stem from generation, execution, or conversion
Tailor coaching and enablement to the specific dimension that is lagging
Inform territory design, SDR support, and capacity planning
For example, reps with strong execution signals but a limited pipeline may benefit most from additional sourcing support, while reps with a large but weak pipeline may need tighter qualification and deal inspection.
Sales Ops – Recommended Actions
Coaching & Development
Focus on qualification and validation coaching where Spotlight.ai scores lag.
Reinforce disciplined pipeline building when volume outpaces deal quality.
Forecast & Pipeline Discipline
Adjust forecast confidence based on the balance of pipeline size and Spotlight.ai scores.
Use this chart to pressure-test commit assumptions.
Resource Allocation
Prioritize inbound or SDR support for reps with strong execution signals.
Be cautious when adding pipeline to reps showing consistently weak deal health.
Performance Monitoring
Track rep movement across quadrants and conversion color shifts over time.
Treat sustained imbalances as early intervention signals.
Important Interpretation Notes
Spotlight.ai scores reflect deal health, not quota attainment.
Conversion rate reflects effectiveness, not deal size.
A high pipeline alone does not guarantee revenue.
Always interpret this chart alongside tenure, territory, and deal mix.