
Analytics Page: Loss / Slippage Analysis Chart
Overview
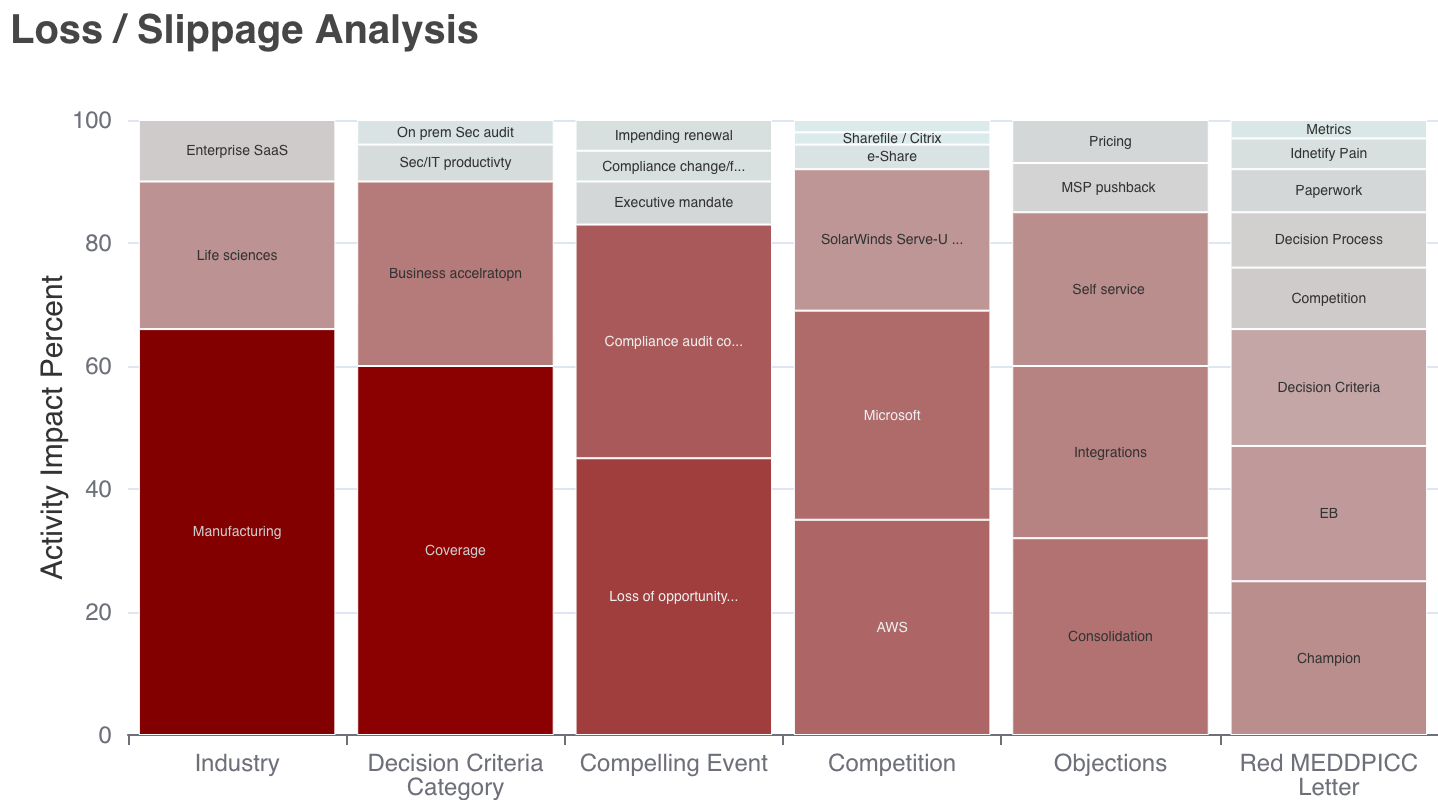
The Loss / Slippage Analysis chart shows how answers to Spotlight.ai Questions are associated with deals that were lost or slipped. It highlights the top contributing Questions - those whose answers have the strongest association with loss or slippage in your data.
Only the Questions with the highest impact are shown. The absence of a Question does not mean it is unimportant, only that it was less influential relative to others in this analysis.
How to Read the Chart
- Each column represents a top contributing Spotlight.ai Question.
- Each segment within a column represents an answer to that Question.
- Larger segments indicate a stronger association with losses or slippage, based on historical deal outcomes.
- The chart is normalized to show relative impact, not raw deal volume.
For example, if one answer occupies a larger portion of a column, it indicates that this answer appears more frequently in lost or slipped deals compared to other answers for the same Question.
What This Chart Is (and Isn't)
This chart is:
- A view into the strongest risk signals across your deals
- A way to identify recurring patterns in losses or slippage
- Useful for comparing the relative impact among the most influential Questions
This chart is not:
- A complete view of all Questions in your workspace
- A definitive explanation for why individual deals were lost
- Proof that a specific answer alone causes deal failure
How Sales Ops Should Use This
- Focus attention on high-impact risk signals during deal reviews
- Challenge deal health and forecast confidence when these answers are present
- Inform enablement, coaching, and process improvements
- Monitor shifts in top contributing Questions over time to detect changes in deal risk
For example, when a new Question begins to appear among the top contributors, it may indicate emerging objections, competitive pressure, or execution gaps.
Sales Ops – Recommended Actions
Risk Identification & Deal Reviews
- Flag deals that match multiple high-impact loss or slippage answers.
- Require deeper inspection or manager review when these signals are present.
Enablement & Process Improvements
- Address recurring loss patterns with updated playbooks, training, or qualification guidance.
- Strengthen coaching around Questions that consistently correlate with stalled or lost deals.
Pipeline & Forecast Discipline
- Adjust forecast confidence when high-risk answers appear.
- Use this analysis to pressure-test close dates and commit assumptions.
Trend Monitoring
- Review this chart regularly to identify emerging risk patterns.
- Treat sustained changes as signals to revisit qualification standards or sales motions.
Key Reminder
This analysis reflects correlation, not causation. High-impact answers indicate where losses or slippage tend to concentrate in your data, but outcomes still depend on execution, timing, and deal context.